True Seasonality Indicator
CONCEPTS
True Seasonality Indicator designed to forecast price based on historical data, best use on daily chart.
DETAILS & EXAMPLE OF HOW TO USE
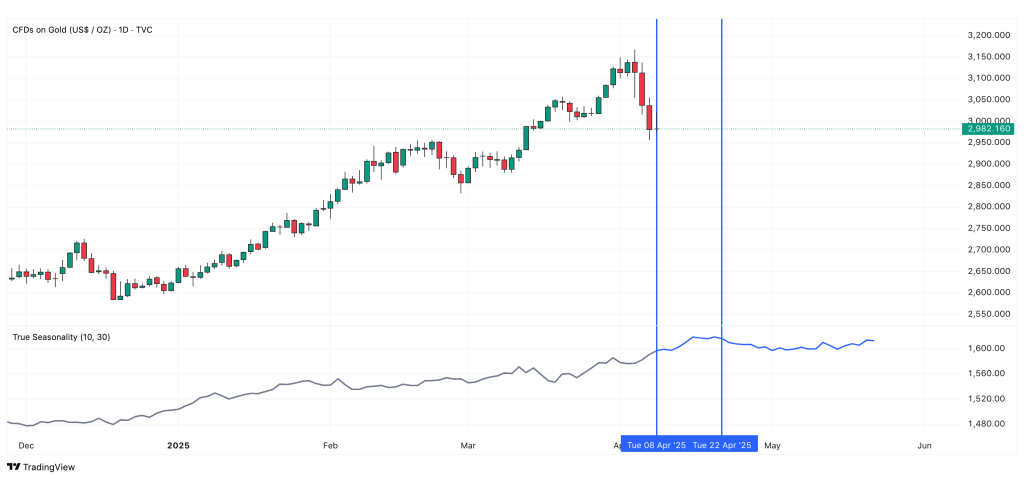
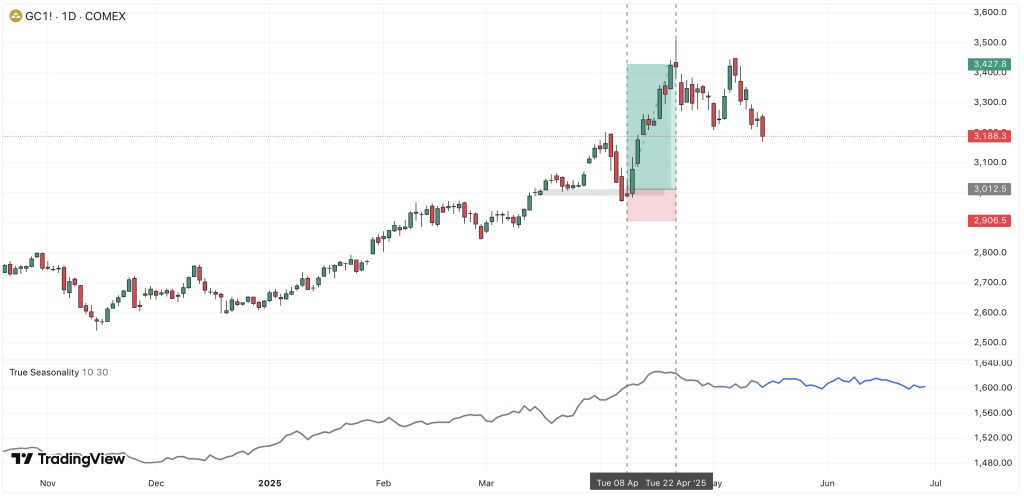
On Gold chart, the blue graph indicate the few projected days in the future. On 8 April 2025, the indicator showing potential uptrend movement until mid of April, and after that sideways for sometimes.

Combine with other technical strategy on the same timeframe or even lower timeframe, for example using Supply & Demand to find the entry, it resulted with 1:4R profit.
FEATURES
- Adjustable forecast bars & lookback
NOTES
- The Indicator is best applied on daily chart.
- Should be combined with other lower-timeframe technical tools like supply and demand to find entry and confirmation.