Valuation Tool Indicator
OVERVIEW
Valuation Indicator is a trading tool which designed to help you identify the relative value of an asset, compared to the other asset.
CONCEPTS
The Indicator help you calculate the relative value between chosen assets by measuring their price deviation, for example comparing NASDAQ with Dollar Index or Treasury Bond. It is used primarily to identify overbought and oversold conditions.
To understand its relative value, Equities and Indices are usually compared to the Treasury Bond and Dollar Index, meanwhile other asset like Major FX Pairs, Precious Metals, and Energies are compared to Dollar Index.
The Indicator comes with adjustable parameters, like threshold, timeframe, and smooth value to flexibly reduce noice and improve accuracy.
DETAILS & EXAMPLE OF HOW TO USE
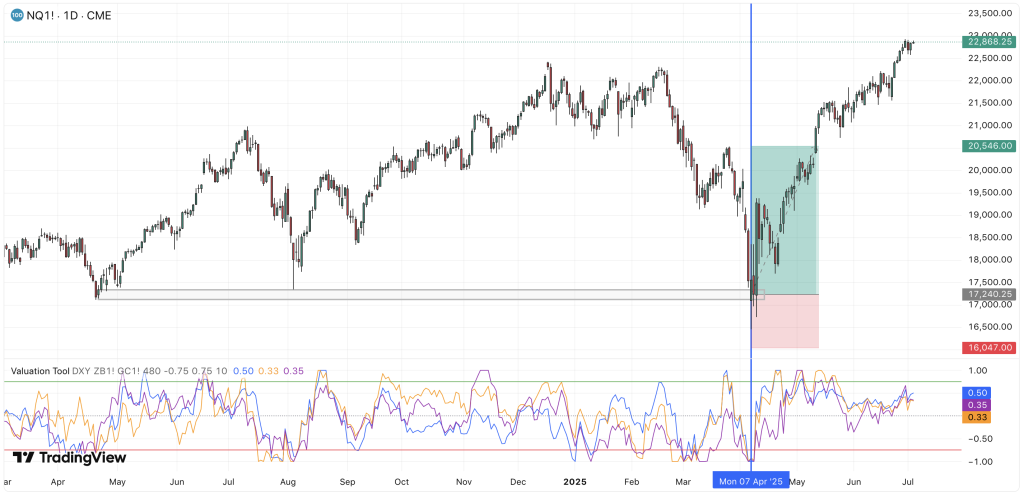
An example of Nasdaq chart to demonstrate the indicator in real market scenario.
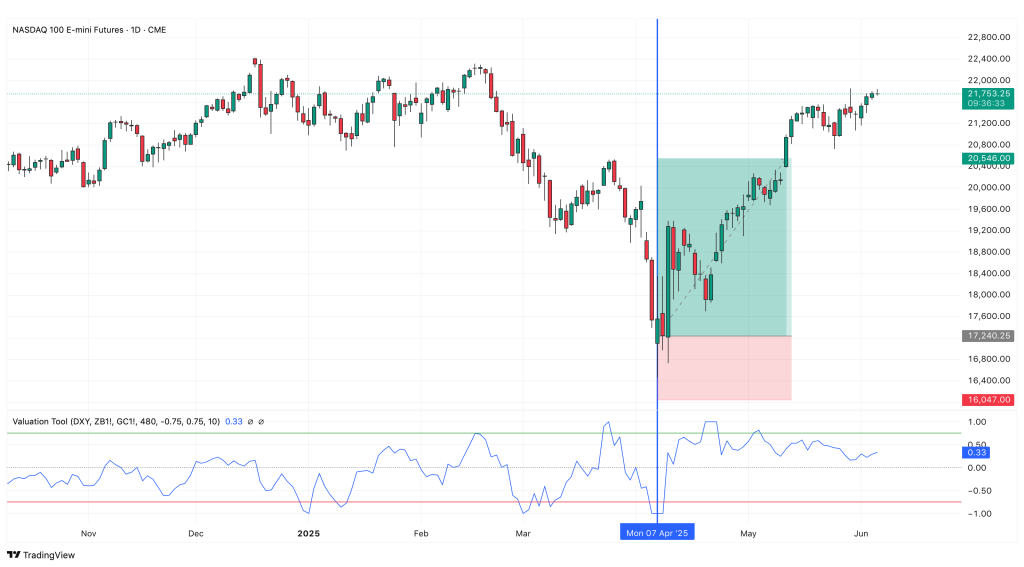
Blue graph indicate the Dollar Index (DYX) Index, showing undervalued under -0.75 level.
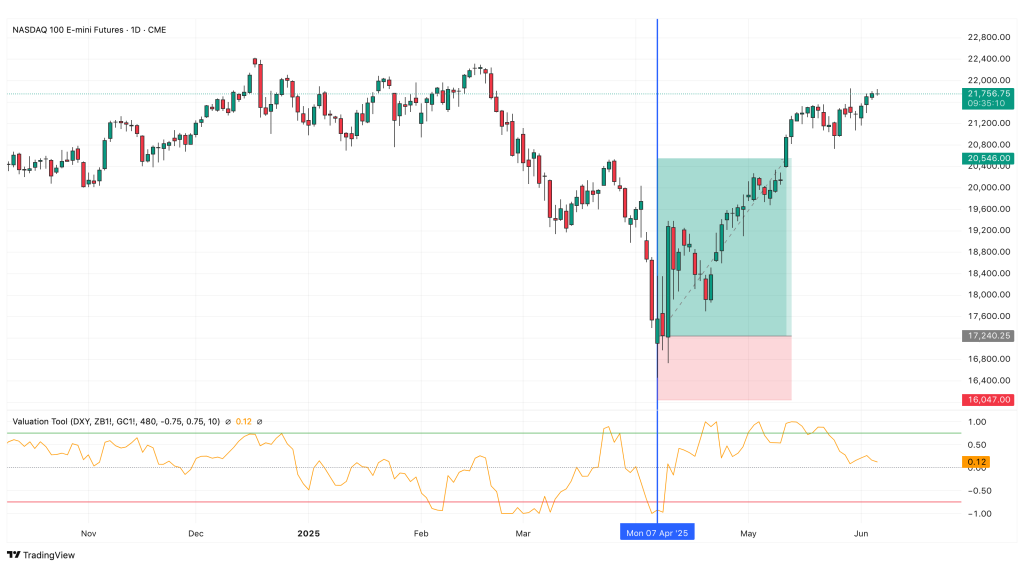
On the same time, Orange graph indicate the Treasury Bond Index, showing also an undervalued level under -0.75.
Base on those information, combine with other technical strategy on the same timeframe or even lower timeframe. For example using Supply & Demand to find the entry.

The result is a massive push to the upside hitting more than 1:3.
FEATURES
- 3 Flexible symbols to pairing in 1 indicator.
- Show and hide each symbol independently.
- Adjustable timeframe, smoothing value, lower & upper threshold.
NOTES
- Should be combined with other lower-timeframe technical tools like supply and demand.
- The Indicator is best applied on weekly or daily chart.